Cracking the 0DTE Code, Part 2: The 6 Pre‑Market Trading Regimes
Updated: Jul 11, 2026 · Read Part 1
Since publishing this article, my workflow has continued to evolve.
The six SPY pre-market regimes remain an important part of my framework, but I no longer combine them with intraday market-maker delta positioning as a trade signal. I now use the regimes primarily to establish structural context and quantify the historical probabilities of key intraday level interactions.
The probabilities and behaviors described in this article come from historical SPY pre-market regime research. Exact frequencies can shift depending on the dataset, cleaning method, and market environment. The more recent cleaned framework filters bad pre-market OHLC spikes and uses confirmed PMH/PML construction, which improves regime quality but can slightly change the distribution versus earlier versions of the model.
The regimes are not intended to predict every intraday move on their own. Their value is in reducing the trading day to a smaller set of statistically grounded scenarios and providing context for specific setups as they develop.
In Part 5, the final installment of this series, I’ll bring the current framework together by combining these regimes with specific 0DTE setups using the z-score of a call option’s extrinsic value.
Intro
In Part 1, we showed why static (“naive”) gamma maps are great for pre‑market terrain but weak for intraday timing. In Part 2, we add a second lens: pre‑market structure on SPY. By classifying the open into six regimes, we can attach unconditional and conditional probabilities to the day’s key level interactions. (Note: this applies to SPY; SPX doesn’t trade pre‑market.)
Key Levels & Notation
- PMH = Pre‑Market High
- PML = Pre‑Market Low
- YDH = Yesterday’s High
- YDL = Yesterday’s Low
The Six Pre‑Market Regimes
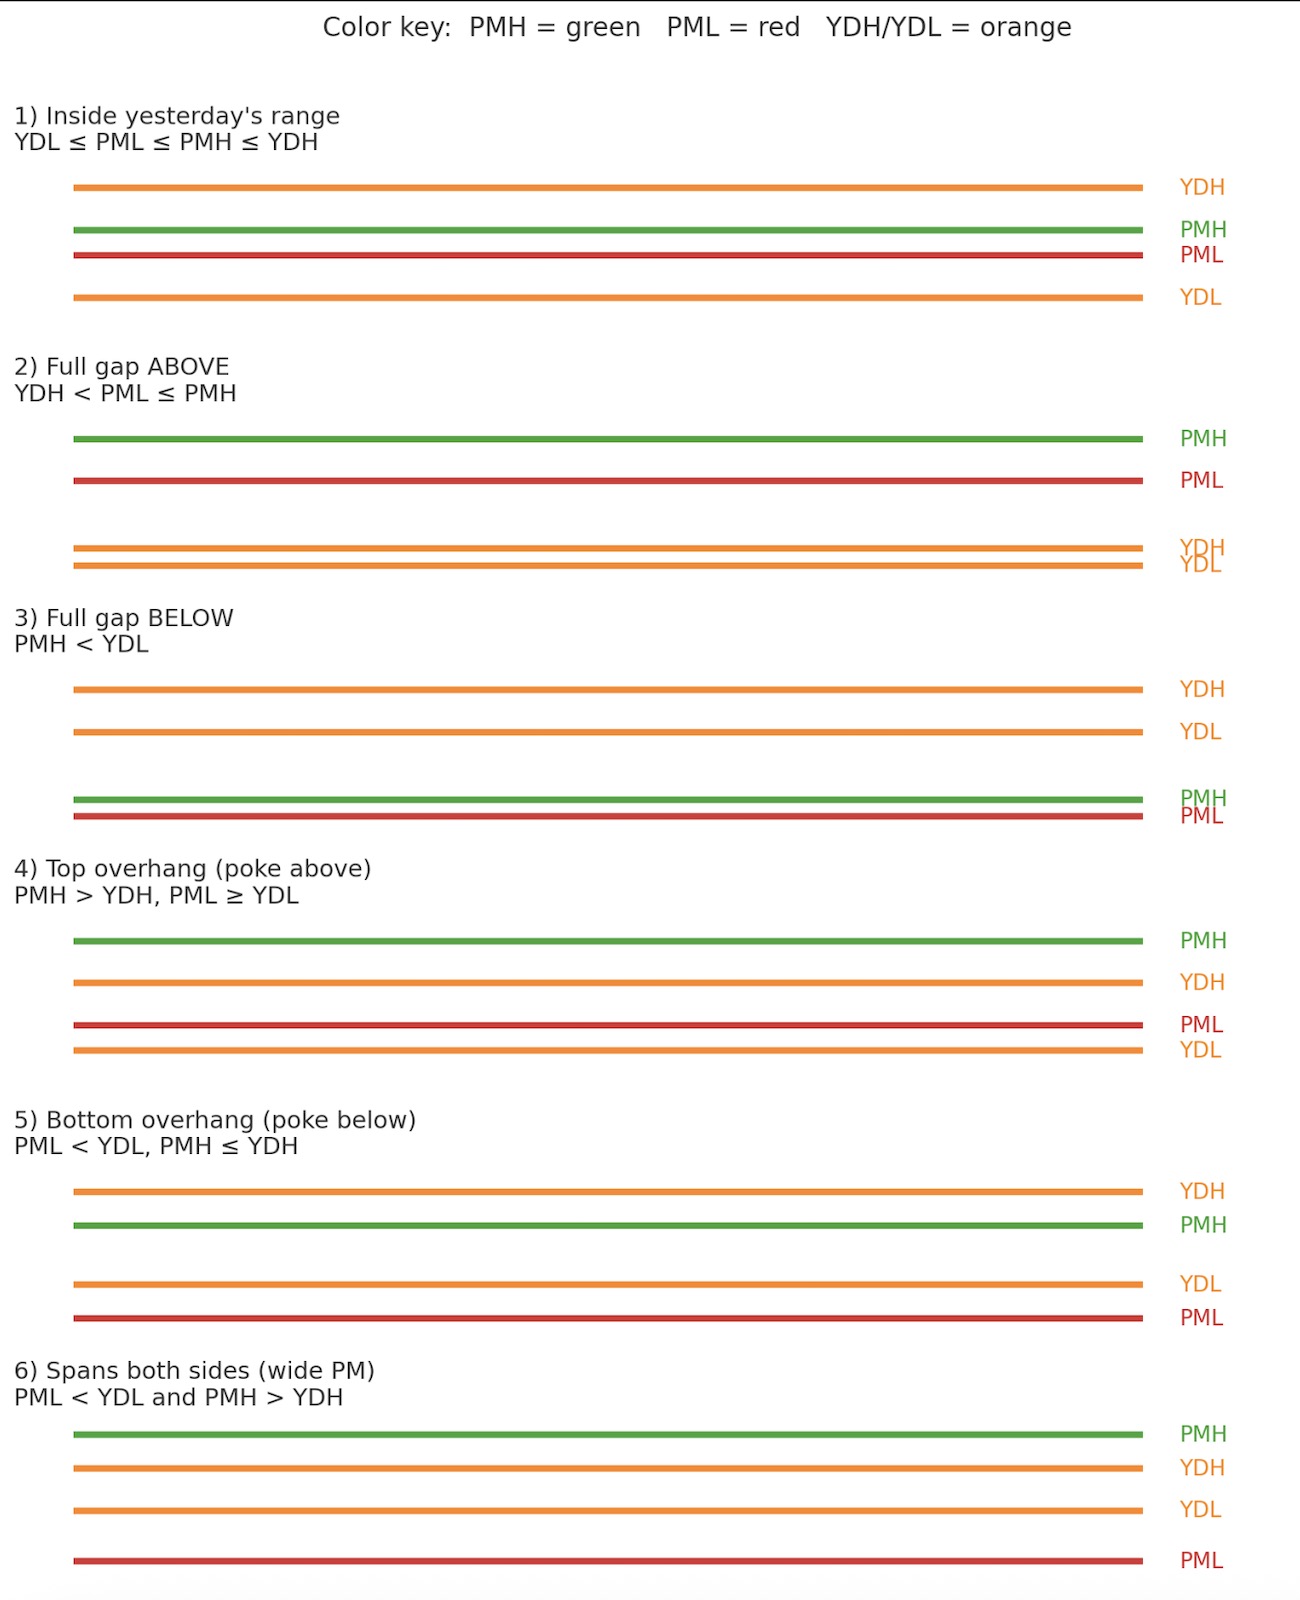
Visual overview of the six SPY pre-market trading regimes.
| Regime | Definition | Typical Tendency |
|---|---|---|
| 1) Inside Yesterday’s Range | YDL ≤ PML ≤ PMH ≤ YDH — pre‑market fully inside yesterday’s range. |
Lower‑volatility; mean‑reverting sessions common. |
| 2) Full Gap Above | YDH < PML ≤ PMH — full gap above yesterday’s high. |
Breakaway potential; high odds of a backtest first. |
| 3) Full Gap Below | PMH < YDL — full gap below yesterday’s low. |
Bearish skew; frequent retests of breakdown area. |
| 4) Top Overhang (poke above) | PMH > YDH, PML ≥ YDL — pre-market poked above yesterday’s high but stayed supported above yesterday’s low. |
Short-trap dynamics; often fuels continuation higher. |
| 5) Bottom Overhang (poke below) | PML < YDL, PMH ≤ YDH — pre-market poked below yesterday’s low but stayed capped below yesterday’s high. |
Long-trap dynamics; often sets up reversal rallies. |
| 6) Spans Both Sides (Wide PM) | PML < YDL and PMH > YDH — exceeded both extremes. |
Expansion regime; typically high intraday volatility. |
How Often Each Regime Appears
Before looking at trade setups, it helps to understand how often each structure actually shows up. In my cleaned SPY pre-market research sample, the regime distribution looked like this:
| Regime | Description | Frequency |
|---|---|---|
| Regime 1 | Inside / mixed / overlapping structure | 29.69% |
| Regime 2 | Full gap above yesterday’s range | 1.61% |
| Regime 3 | Full gap below yesterday’s range | 1.50% |
| Regime 4 | Top overhang / pre-market poke above YDH | 37.74% |
| Regime 5 | Bottom overhang / pre-market poke below YDL | 25.09% |
| Regime 6 | Wide pre-market range spanning both sides | 2.53% |
| Unknown / filtered | Insufficient, overlapping, or filtered level data | 1.84% |
Regime 4 and Regime 1 make up the largest share of days, followed by Regime 5. Full gap regimes, Regime 2 and Regime 3, are relatively rare. Regime 6 is also uncommon, but when it appears it often signals a wider volatility environment.
This matters because a setup that looks attractive in a rare regime may not provide many opportunities over time. For 0DTE trading, the goal is not just to find a setup with theoretical edge. The goal is to find structures that appear often enough to matter while still being selective enough to avoid low-quality chop.
The Probabilities Framework
Once the regime is known, frame the day with two sets of stats:
Unconditional probabilities
- Close crosses above/below PMH/PML?
- Tags/breaks of YDH/YDL?
Conditional probabilities (examples)
P(YDH | ↑PMH close)P(YDL | ↑PMH close)P(YDL | ↓PML close)P(YDH | ↓PML close)P(PMH | ↑YDH close)P(PML | ↓YDL close)P(PMH | ↓YDL close)P(PML | ↓YDH close)P(PMH | ↑YDL close)P(PML | ↑YDL close)
P(YDH | ↑PMH close) = Probability that YDH is tagged/broken given a candle close above PMH. Any timeframe works; I prefer 5‑minute for balance of accuracy and hit rate. Not all conditionals apply in every regime based on opening location.
Putting It Together with 0DTE Flow
Use the regime probabilities to build a practical intraday playbook:
- Inside range: Fade extremes and favor mean reversion. PMH-to-PML and PML-to-PMH rotations are common. Watch for confirmed breaks before treating an extreme as a breakout.
- Full gaps: Look for backtests before continuation.
- Overhangs: Watch for failed pokes to reverse, or continuation traps to spring.
- Wide spans: Expect multiple high-volatility setups.
For 0DTE traders, this framework provides a structured edge by narrowing the focus from "infinite possibilities" to six probabilistic scenarios, each with measurable odds. It encourages inaction during chop and trading only when the setup aligns with the regime.
Confirmation tip: wait for a close beyond your level; if a subsequent candle closes back across against your bias, consider exiting. Always respect theta. If trading futures, you can avoid theta decay, which is one advantage.
Closing Thoughts
Traders often say “it’s a game of probabilities,” but rarely quantify them. The six SPY pre‑market regimes provide a measurable, repeatable framework for answering two practical questions:
- What is the likely character of today’s session?
- What are the historical odds of key level interactions within this regime?
The goal is not to predict every move. It is to reduce the day to a smaller set of statistically grounded scenarios and wait for price action to confirm which one is developing.
In Part 5, the final installment of this series, we’ll bring the framework together by combining these regimes with specific 0DTE setups using the z-score of a call option’s extrinsic value. This adds a real-time measure of whether call premium is unusually rich or cheap relative to its recent behavior, giving us a way to pair the day’s statistical regime with a specific execution setup.
Join the Community & Get the Tool
If this was useful, hop into the free Foxchase Trading Discord for daily setups, regime probabilities, and discussion. The raw probability tables are pinned there for free if you’d rather build your own tool.
TradingView SPY Key Levels & Regimes Indicator — Put this framework to work instantly:
👉 whop.com/foxchase-trading/spy-key-levels-regimes-indicator