
The Long End’s Silent Reset: Why Treasury Yields Can Rise Without a Clear Catalyst
7 min read · by Adam
Thus far, we have had no major data surprise, no sudden Fed pivot, and no dramatic front-end repricing. And yet the 10-year and 30-year are beginning to suggest that the next move in the long end may not need a single obvious catalyst.
The Long End Does Not Need a Single Trigger
Short maturities tend to move with clearer cause-and-effect logic. If the market suddenly changes its view on Fed policy, the front end usually reacts first. The long end is different.
Long-end yields can rise even when the front end is relatively stable, because the market is not just pricing the policy rate. It is pricing inflation uncertainty, fiscal supply, duration risk, and the compensation investors demand for holding longer-dated paper. The New York Fed’s term premium framework exists for exactly this reason: long yields are not simply an average of expected short rates. They also include additional premium for interest-rate risk over time.
The long end can still reprice because investors are demanding more compensation to own duration.
What Has Changed in 2026
The rate cuts narrative has significantly weakened. Reuters’ March 11 strategist poll still showed a fairly modest baseline forecast for the 10-year, but even that reflected a market wrestling with inflation and supply pressures rather than confidently pricing an easy rally in bonds. At that point, the median forecast was for the 10-year yield to trade around current levels by end-May, then drift only slightly higher over six to 12 months.
Since then, the market has witnessed a new inflation scare tied to energy and geopolitics. By late March, the 10-year had its biggest monthly rise in well over a year, climbing more than 40 basis points during the month, while the 30-year also moved sharply higher.
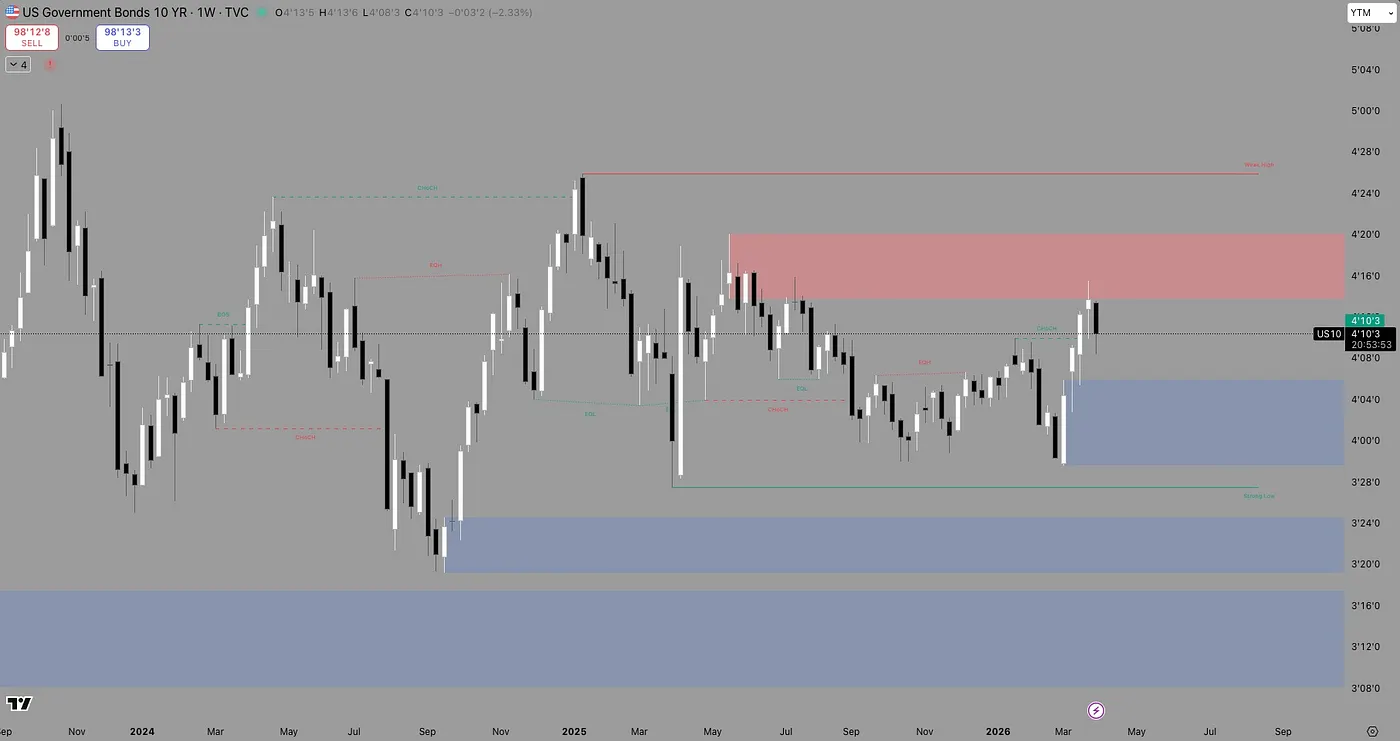
Even after a partial retracement, yields remain elevated into April. On April 1, reporting showed the 10-year around 4.28% to 4.34% and the 30-year near 4.88%, with the market still balancing resilience in economic data against war-driven inflation fears.
Why the Long End Can Sell Off Even Without a Front-End Shock
There are four main reasons:
Term premium repricing
This is the cleanest answer when the move seems difficult to explain with policy alone. If investors become less comfortable owning long-duration debt, yields can rise even if the expected path of the Fed does not change much. That is what term premium is meant to capture. The New York Fed’s ACM series is the standard reference point for this kind of analysis.
Fiscal and supply pressure
In the Treasury’s February 2026 refunding statement, the department said it expected to maintain current nominal coupon auction sizes for at least the next several quarters. That included sizable 10-year, 20-year, and 30-year issuance.
Inflation-risk repricing
Sometimes the market is not changing its view on the Fed itself as much as it is changing its view on what inflation may do to the long end. That has been especially relevant lately. Many are repeatedly pointing to oil and geopolitical tensions as drivers of higher yields and reduced confidence in near-term easing. Fed officials have also acknowledged the risk that supply shocks and higher energy prices could keep inflation above target for longer.
Positioning and flow resets
Sometimes the move is less macro than mechanical. Quarter-end and month-end rebalancing, crowded duration positioning, and violent unwind activity can all move yields sharply with no single headline that fully explains it. On March 30, for example, Treasury yields fell sharply partly because of quarter-end buying and rebalancing after a prior selloff. The reverse can also happen. A move higher in yields can continue simply because investors who were leaning too hard the other way are forced to adjust.
My Thesis: Bearish Long End
I believe the long end remains in a structurally bearish regime, but the move is unlikely to be linear. The bearish case is not just about Fed expectations. It is about a broader repricing of duration risk driven by inflation uncertainty, supply and fiscal pressure, and a market that appears to be demanding more compensation to hold longer-dated Treasuries.
Technically, I think it helps to separate the outlook into potentially two different clocks.
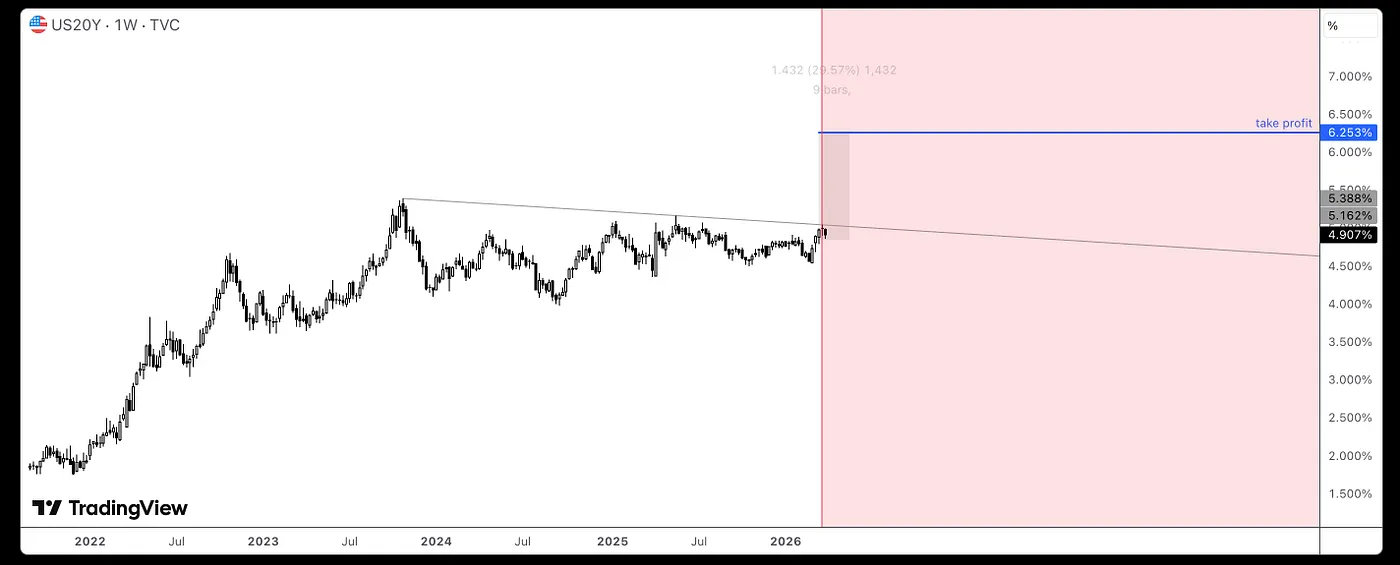
The first is a shorter-term absolute-yield clock. On the US20Y weekly chart, one projection suggests a possible nine-bar runway that could carry the 20-year yield materially higher in the near term, with an aggressive upside path toward roughly 6.25% by mid-May. I do not treat that as a guaranteed forecast, but I do treat it as evidence that the long end may still have room for a fast repricing move before any larger reversal develops.
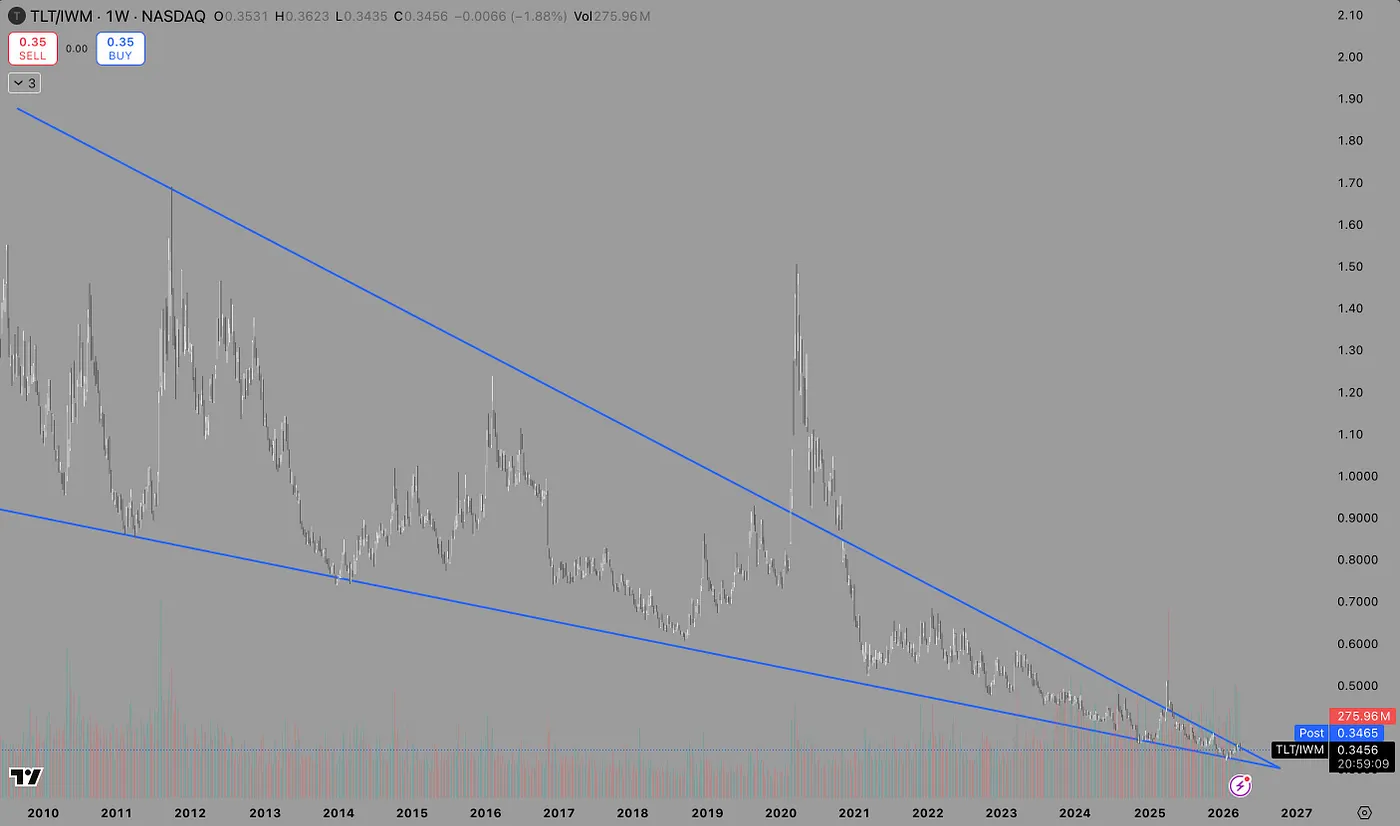
The second is a longer-term relative-performance clock. The multi-year TLT/IWM wedge appears to point toward a broader resolution window later in 2026, potentially closer to November. That does not mean yields must wait until November to rise. It means the broader cross-asset regime between bonds and risk assets may take longer to fully resolve, even if yields make an important move much sooner. More on that at the end...
A sharp move in yields by May and a larger wedge resolution by November are not contradictory. The market can accelerate first, then consolidate, reverse, or retest before the bigger regime finally resolves. At the same time, I do not think this necessarily becomes a one-way collapse in bond prices forever.
There is also a major lower technical zone in long duration bonds that could eventually become important if the selloff continues far enough. In other words, the bearish case may still have room to develop, but the deeper the move becomes, the more traders should start thinking about exhaustion, support, and the potential for a significant reflex rally rather than endless continuation.
Why ZB Matters Here
Another way to frame the long-end thesis is through 30-year Treasury bond futures, or /ZB.
ZB reflects the market’s view of long-duration U.S. government debt, which means it is highly sensitive to the same forces driving the broader long end: inflation expectations, fiscal supply, Fed signaling, and shifts in risk appetite. When ZB falls, it usually means long-end yields are rising. When ZB rises, it usually means yields are falling and duration is catching a bid.
What makes the current backdrop especially interesting is that bonds have not consistently behaved like a traditional geopolitical safe haven. Instead of rallying cleanly on headline stress, the long end has repeatedly struggled under the weight of inflation concerns, energy risk, and the possibility of heavier fiscal borrowing. That is one reason the long bond remains such an important read on macro sentiment right now.
As of April 1, it appears buyers are failing to defend 114 on /ZB, signaling the long bond likely has room to continue lower. In practical terms, that would mean the market is still repricing higher long-end yields, likely because inflation risk, supply concerns, and fiscal pressure are continuing to outweigh the usual defensive bid for Treasuries.
That said, I do not think the downside is infinite. There is also a major lower technical zone near 101 on /ZB that could become very important if the selloff extends far enough. I do not view that as an immediate or guaranteed target, but I do view it as a possible longer-term completion area where bearish momentum could become much more mature and where the odds of a significant bounce could materialize.
The TLT/IWM Ratio
One cross-asset I continue to watch is the ratio of TLT to IWM, the small cap ETF. If that ratio continues rejecting its upper trendline and rolling back inside the wedge, it would reinforce the idea that bonds remain a laggard relative to risk assets. That would fit the broader bearish-duration thesis.
That said, ratio charts need to be handled carefully. A falling TLT/IWM ratio does not automatically mean TLT is falling in absolute terms. It can also mean IWM is simply rising faster than TLT. So I do not use the ratio chart as standalone proof that bonds must sell off. I use it as confirmation. If TLT itself is weak when TLT/IWM is also underperforming, that is a much cleaner signal than the ratio alone.

Closing Thoughts
I also post additional thoughts on X occasionally. If you want my exact positions, trade management, and real-time commentary, I keep that inside the subscribers section of my Discord. My public Discord remains freely accessible for daily thoughts and trade updates.