Spot Up, Vol Up, Ramp Up: A Lesson in Price Discovery
August 4, 2026 · by Adam
One of the most commonly recognized behaviors in the market is that when the underlying price rises, volatility falls. When the market falls, volatility rises.
That inverse relationship often becomes instinctive for traders. A rising VIX or VXX is commonly interpreted as bearish, while a decline in volatility is treated as confirmation that an equity rally is healthy.
But this relationship does not always hold. You have probably seen the exception before: SPY rises while VXX rises with it. SPY call options appreciate from the movement in the underlying, while their extrinsic value also remains elevated, or even increases, despite the passage of time and the effect of theta.
Instead of producing the reversal normally associated with elevated option premium, the market continues grinding higher.
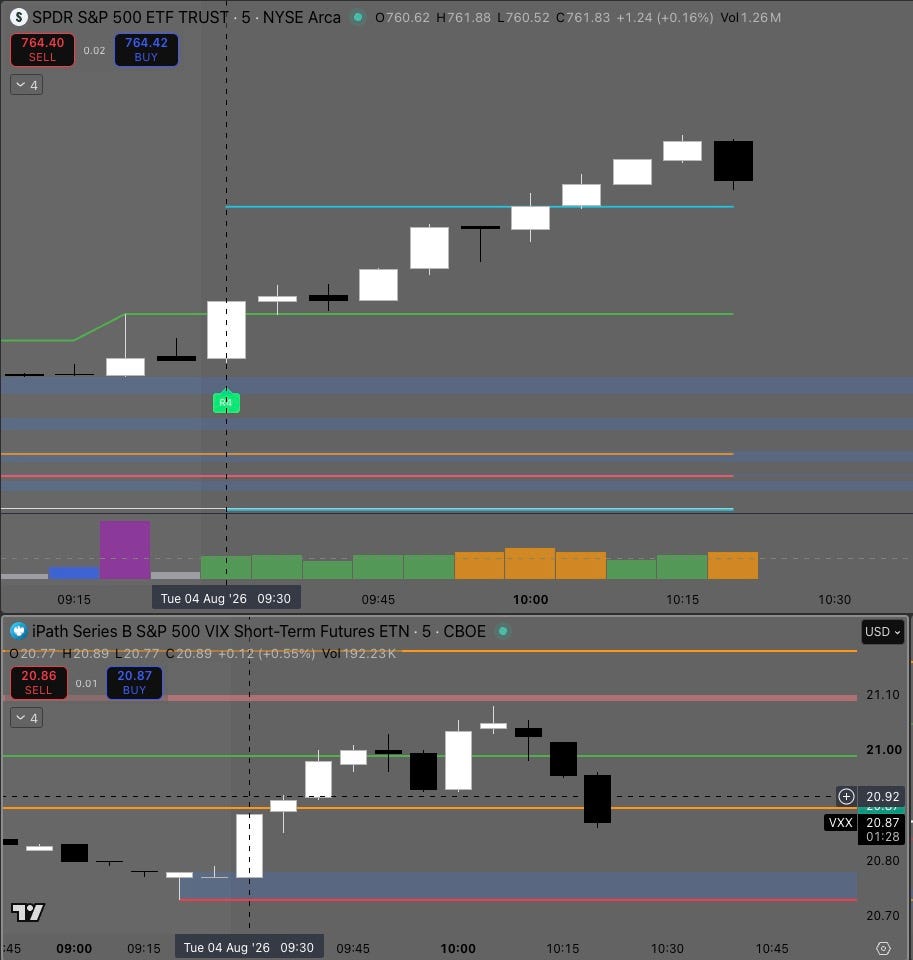
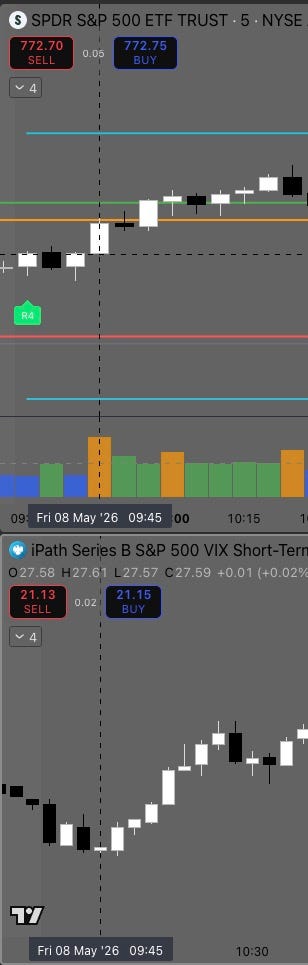
Two recent examples occurred on May 8 and August 4, 2026. Both sessions developed within the same Regime 4 volatility-compression setup, or R4-VC, within the Foxchase Trading framework. Both also shared another important characteristic: they were new all-time-high days.
The S&P 500 and Nasdaq reached records on May 8, while the S&P 500 returned to record territory and established a new intraday high on August 4. The same Regime 4 structure appeared on both days, along with the opening spike in SPY call extrinsic value. The extrinsic-value z-score began decaying toward zero. But the sharp downside reversal normally associated with R4-VC, particularly around 10:00 a.m., never arrived. Instead, SPY continued grinding higher while VXX rose alongside it. That shared all-time-high context turned out to be an important clue. Let’s review the basics of the setup.
What Is Regime 4?
The Foxchase Trading regime framework classifies each session according to the order of four important reference levels:
- Premarket high, or PMH
- Premarket low, or PML
- Yesterday high, or YDH
- Yesterday low, or YDL
In Regime 4, those levels are arranged from highest to lowest as follows:
PMH → YDH → PML → YDL
For a complete visual explanation of the 6-regime framework, see Cracking the 0DTE Code, Part 2: The 6 Pre-Market Trading Regimes.
This structure tells us that the premarket range has expanded beyond both sides of the previous day’s range. The premarket high is above the prior-day high, while the premarket low is below it but remains above the prior-day low. The regime itself does not automatically dictate direction. It merely establishes the market structure in which a particular setup may develop.
One important A+ setup within this regime is R4-VC, where SPY initially pushes higher while call extrinsic value spikes after the open. As the morning progresses, the underlying may continue rising, but the opening volatility shock begins to fade. The call gains value from the movement in SPY, while its extrinsic value gradually decays because of falling implied volatility and the continuous effect of theta.
The call’s total price may still be rising, but the composition of that price is changing. More of its value is coming from the movement in the underlying, while less is coming from the market’s willingness to pay for remaining uncertainty. As the call’s extrinsic-value z-score approaches zero, SPY has often already begun weakening. On a standard R4-VC session, this normalization accompanies a sharp downside reversal around 10:00 a.m., sometimes earlier.
What Changed on May 8 and August 4?
May 8 and August 4 began with recognizable R4-VC characteristics. The Regime 4 level structure was present. SPY moved higher after the open. Call extrinsic value spiked at the open and began decaying toward its normal range as SPY continued making new highs. Based on the standard setup, the market appeared to be progressing toward the familiar downside reversal, typically as the call extrinsic-value z-score approaches approximately +1 to +1.5. But VXX was not behaving normally. Rather than declining as SPY advanced, VXX rose with it.
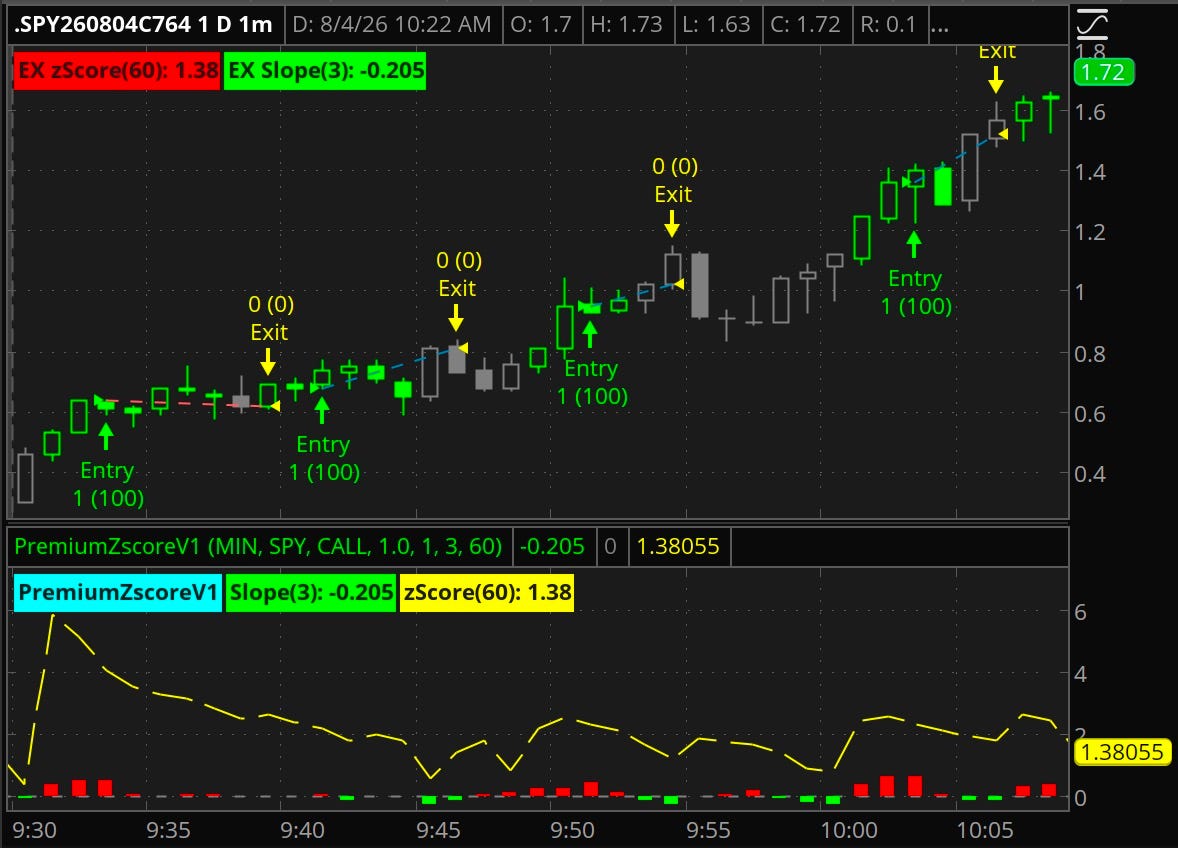
That was the first indication that the opening volatility shock was not undergoing the usual compression. Once the call extrinsic-value z-score reached approximately +1.5, we would normally begin expecting a sharp reversal back below PMH. But it never happened. Instead, the volatility posture reset higher as SPY continued advancing, and this pattern repeated throughout the entire day.
The volatility shock was not fully unwinding; it was being repriced.
Volatility Is Not a Directional Indicator
The VIX is commonly described as the market’s “fear gauge,” but that description can lead traders to treat it as a purely bearish directional indicator. It is not.
The VIX reflects the options market’s expectation of future S&P 500 volatility. It measures how much movement the market is pricing, not necessarily the direction in which that movement must occur. VXX is also not a direct bearish signal. It tracks short-term VIX futures exposure and therefore reflects how the market is pricing forward volatility. We use VXX on our charts because it is tradable, liquid, and can move with or against SPY. Most of the time, falling equity prices are associated with rising volatility because downside moves tend to be faster, more disorderly, and accompanied by increased demand for protection. But volatility can also rise during an equity rally.
Traders may be buying upside calls to participate in a breakout, while existing investors may buy puts to protect recent gains. Market makers may also demand more premium as the expected range of future outcomes widens. Demand for spot and demand for volatility can therefore coexist. That is what appeared to be happening on May 8 and August 4.
The rise in VXX was not causing SPY to rally. Instead, it confirmed that the broader volatility market was not undergoing the normal compression during a standard R4-VC setup. The more direct evidence was visible in the SPY call itself: its extrinsic value remained unusually supported despite theta, even as the call gained intrinsic value from the rise in SPY. That is very different from a rally in which spot rises while volatility steadily collapses.
Understanding Volatility Posture
Within the Foxchase Trading framework, I use the call extrinsic-value z-score to describe the option’s volatility posture. Volatility posture tells us whether the option’s extrinsic premium is unusually elevated, compressed, or close to its expected intraday baseline. On a standard R4-VC session, the call begins with an elevated volatility posture after the opening spike. As VXX and implied volatility decline, the extrinsic-value z-score normalizes toward zero. Under those conditions, the normalization reflects a genuine unwind of the opening volatility shock and often accompanies the R4-VC downside reversal.
On May 8 and August 4, the measured volatility posture still began moving lower, but it did so while VXX was rising alongside SPY.
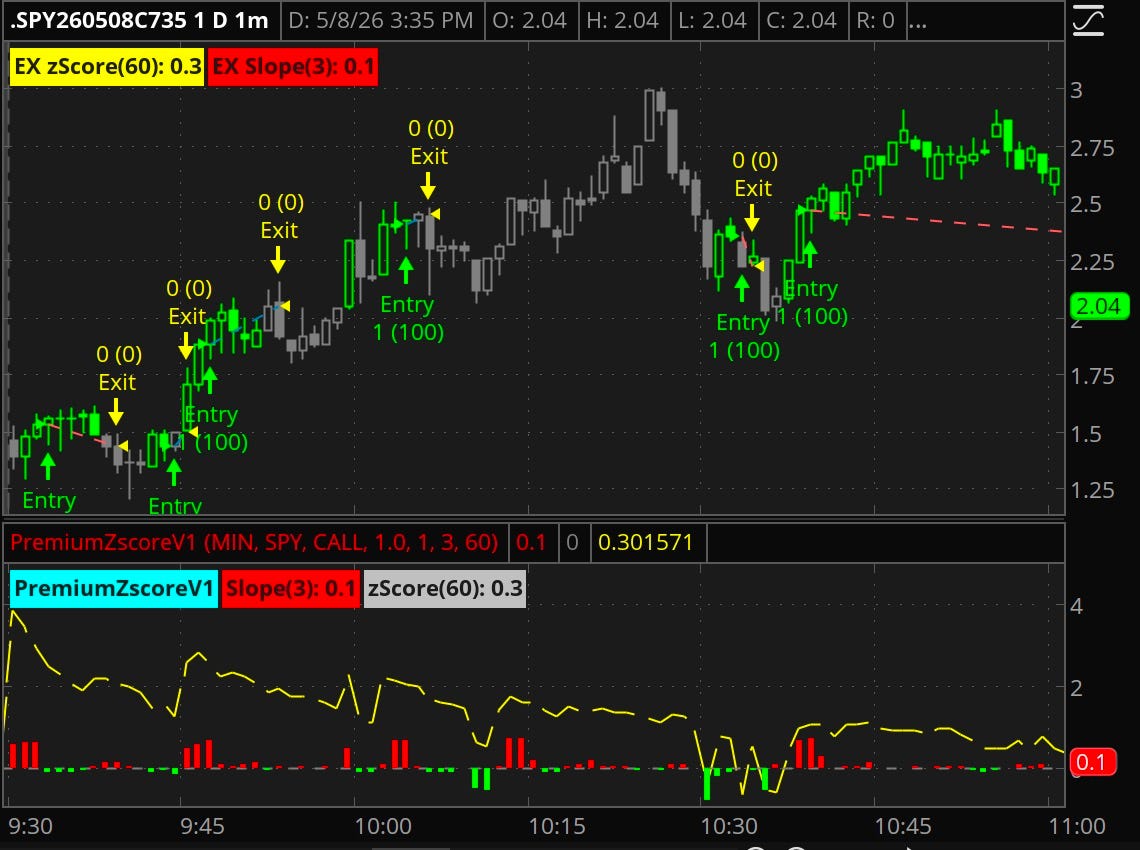
Each time the z-score approached the normal reversal area, it reset higher again as SPY pushed to another high, effectively recharging the volatility posture. It then began decaying from the newly elevated level, only for the pattern to repeat. A call extrinsic-value z-score of approximately +1 to +1.5 means one thing after volatility has steadily compressed from the open and another when the z-score has repeatedly reset higher while spot and volatility rise together. The level matters because of the volatility-compression process that normally brings it there, not simply because the z-score touches a particular number.
The Price-Discovery Connection
The most important characteristic shared by May 8 and August 4 was that both were new all-time-high sessions. At a new all-time high, the market is operating in price discovery. There is no historical trading activity above the current market price: no established resistance overhead, no trapped buyers waiting to exit at breakeven, and no prior volume profile showing where sellers previously became aggressive. The market must discover where meaningful supply will emerge in real time.
I’m not saying that no selling happens. Traders can always take profits, institutions can rebalance, dealers can adjust hedges, systematic strategies can reduce exposure, and new short positions can be opened. As long as buyers continue accepting higher prices and sellers fail to overwhelm them, the auction can continue upward. In these sessions, forward variance was being repriced higher while spot demand remained strong.
This specific R4-VC variation was not included in my book, 0DTE: Regimes, Volatility, and Execution. It is a more recent observation that emerged from comparing these two sessions side by side. The underlying Regime 4 framework was already established, but the significance of SPY and VXX rising together during all-time-high price discovery was not yet fully recognized.
This gives us another reason to keep VXX directly alongside SPY on our charts: it can reveal when the volatility behavior beneath a familiar setup has changed.
These two sessions are not an exhaustive catalog; similar R4 price-discovery behavior has appeared before for readers who compare SPY, the call extrinsic-value z-score, and VXX price action.